
Social Media in 2026 — At a Glance
- Social Media Users 2026
- Global Social Media Users Over the Years
- Social Media Platforms Ranked by Users
- Social Media Users by Country
- Social Media Penetration Rates
- Social Media Demographics
- Time Spent on Social Media
- United States Social Media Data
- Why People Use Social Media
- Where Social Media Is Growing
- Social Media Engagement and Behaviour
- How We Research Social Media Statistics
- Trusted Research Sources
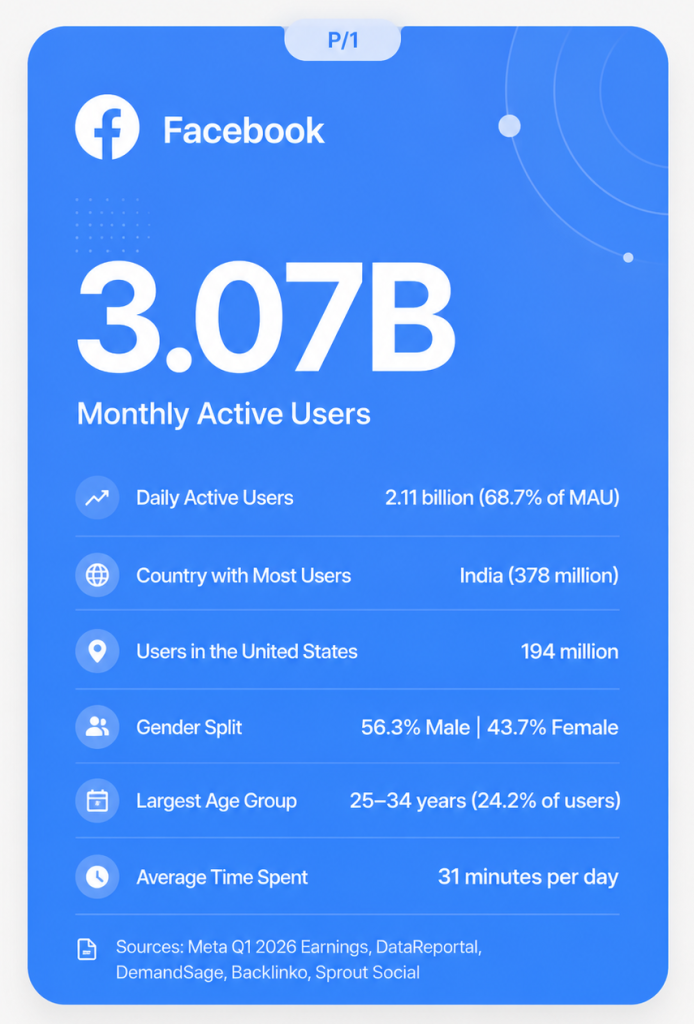
Sources: Meta Q1 2026 Earnings, DataReportal, DemandSage, Backlinko, Sprout Social
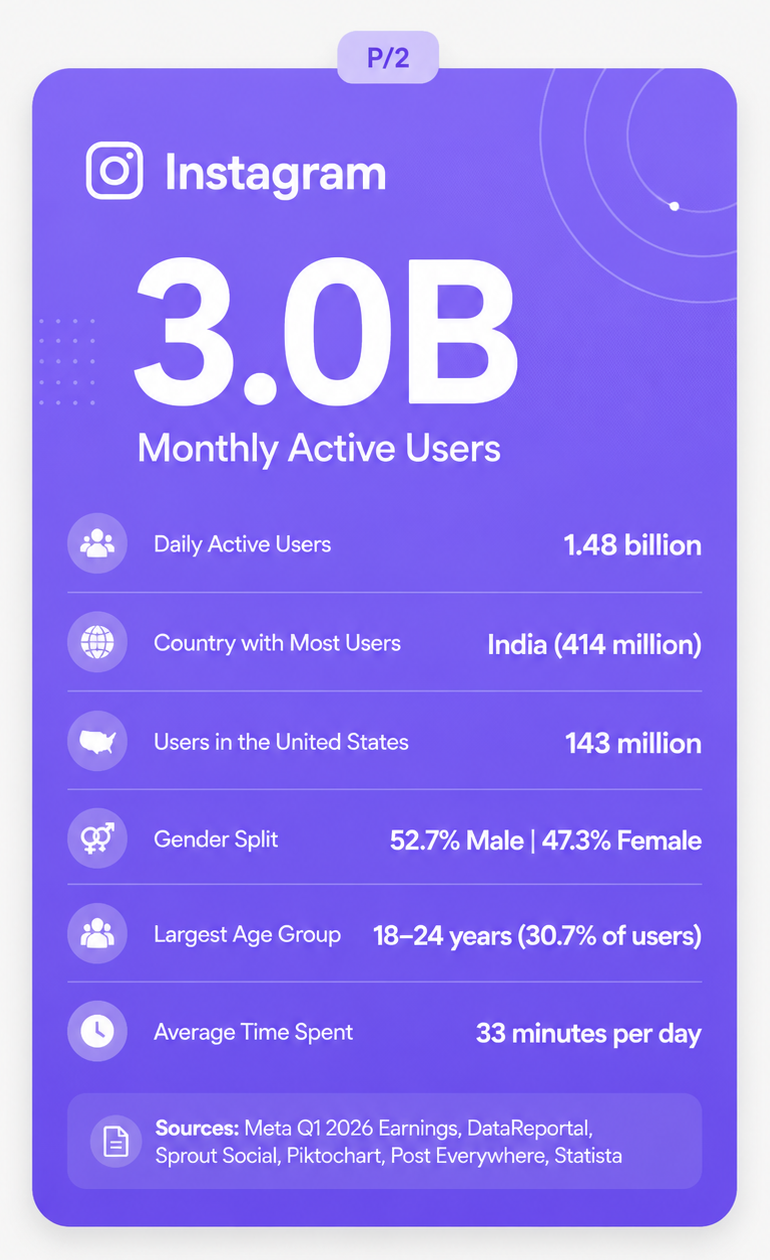
Sources: Meta Q1 2026 Earnings, DataReportal, Sprout Social, Piktochart, Post Everywhere, Statista
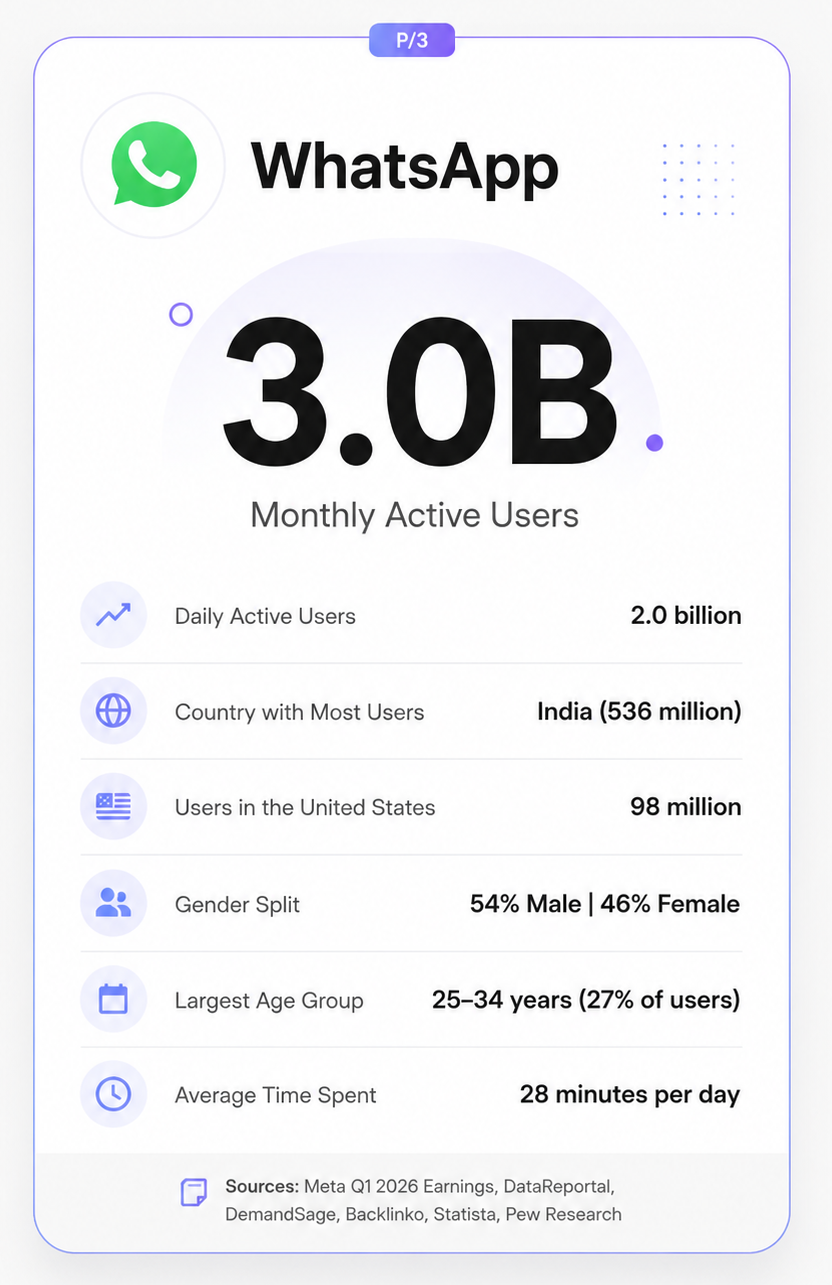
Sources: Meta Q1 2026 Earnings, DataReportal, DemandSage, Backlinko, Statista, Pew Research
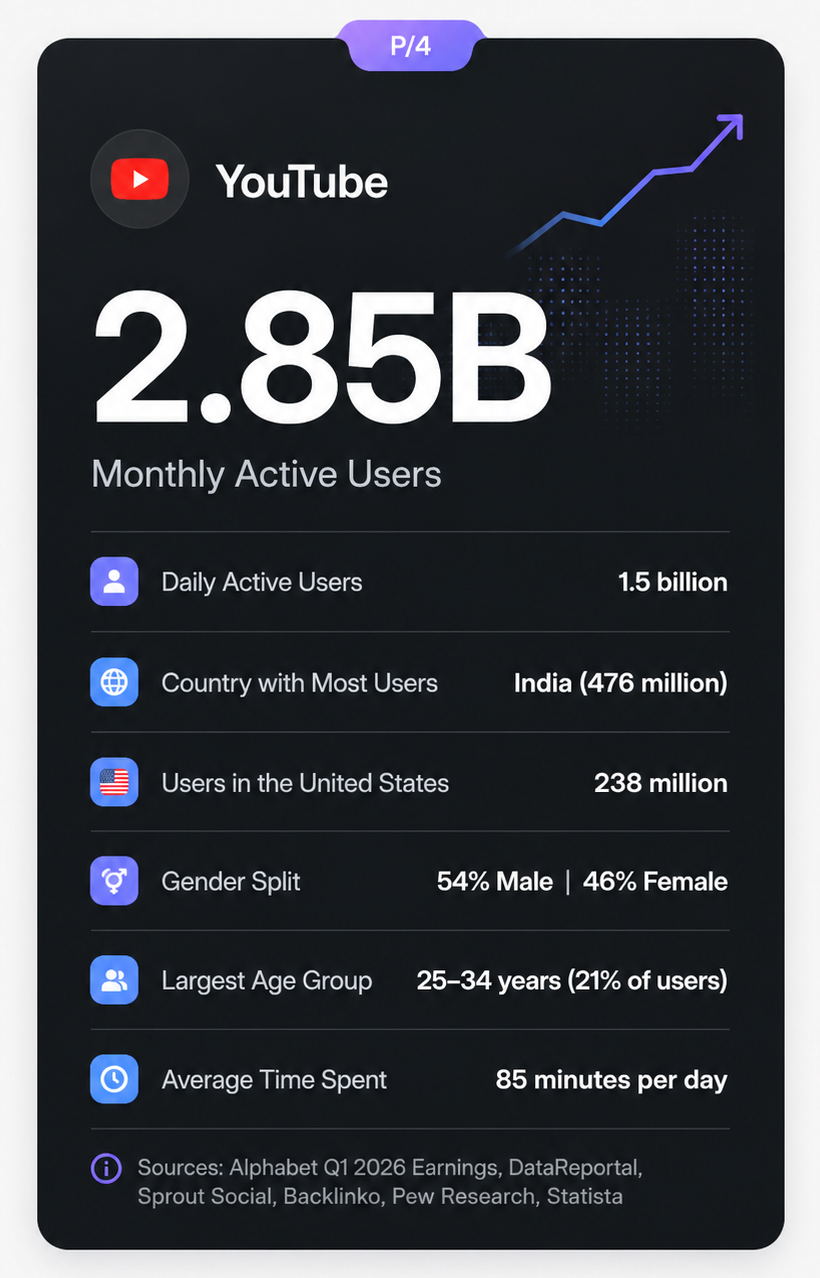
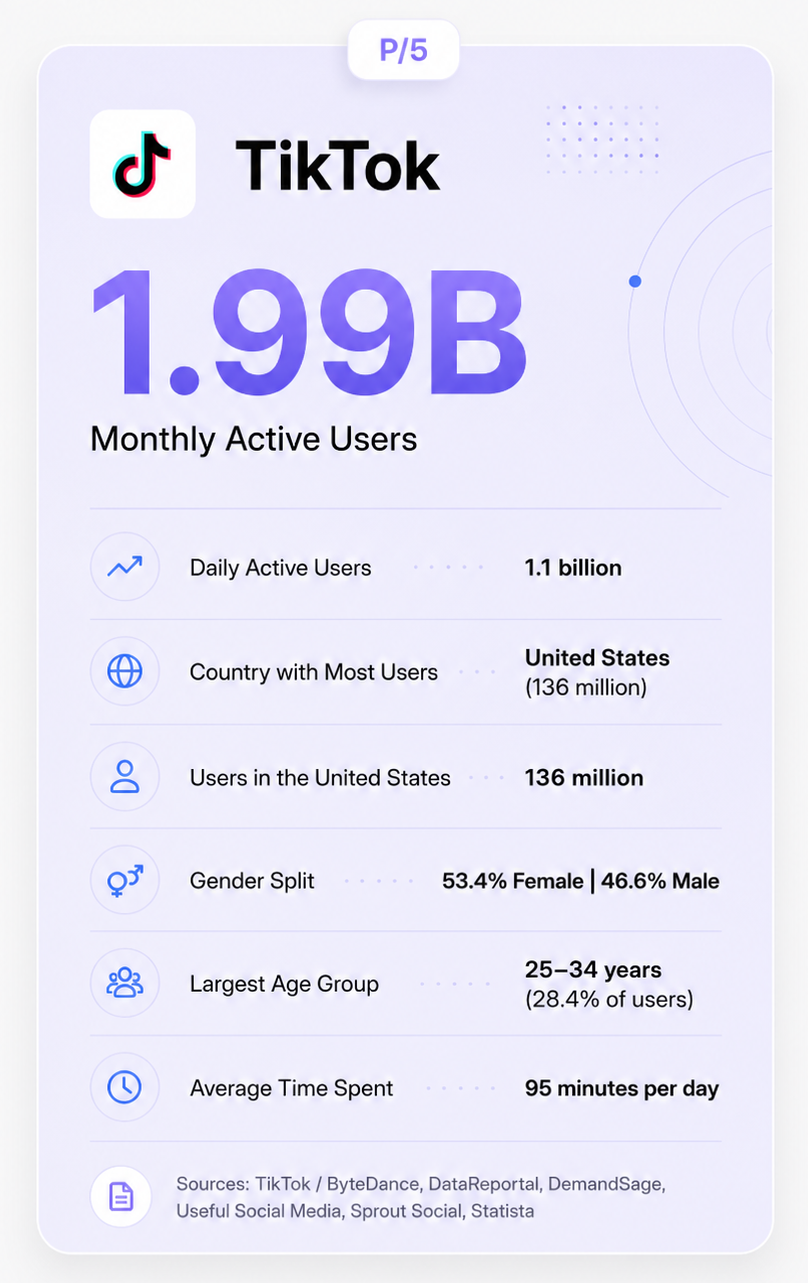
Sources: TikTok / ByteDance, DataReportal, DemandSage, Useful Social Media, Sprout Social, Statista
Sources: TikTok / ByteDance, DataReportal, DemandSage, Useful Social Media, Sprout Social, Statista
| Year | Global Users | % of World Population | YoY Growth |
|---|---|---|---|
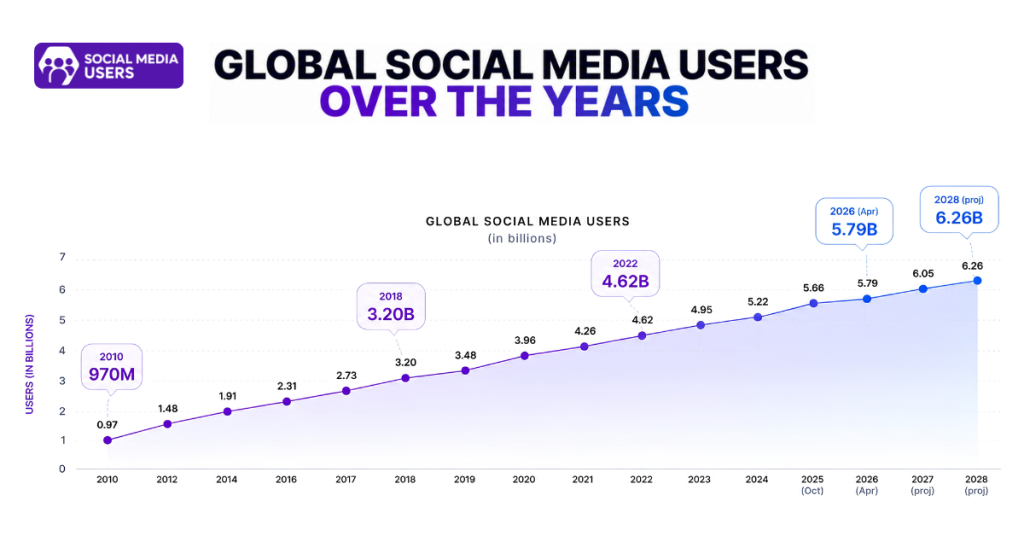
| 2010 | 970 million | 14% | — |
| 2012 | 1.48 billion | 21% | +24.4% |
| 2014 | 1.91 billion | 26% | +12.3% |
| 2016 | 2.31 billion | 31% | +10.3% |
| 2017 | 2.73 billion | 36% | +18.2% |
| 2018 | 3.20 billion | 42% | +13.1% |
| 2019 | 3.48 billion | 45% | +8.7% |
| 2020 | 3.96 billion | 51% | +13.7% |
| 2021 | 4.26 billion | 54% | +7.6% |
| 2022 | 4.62 billion | 58% | +8.5% |
| 2023 | 4.95 billion | 61% | +7.1% |
| 2024 | 5.22 billion | 64% | +5.6% |
| 2025 (Oct) | 5.66 billion | 68.7% | +4.8% |
| 2026 (Apr) | 5.79 billion | 69.9% | +5.4% |
| 2027 (proj) | 6.05 billion | 72% | +4.5% |
| 2028 (proj) | 6.26 billion | 74% | +3.5% |
Table Sources: DataReportal Digital Reports (2010-2026), Statista Digital Population, Kepios Analysis. Figures represent user identities, not unique individuals.
| Rank | Platform | Founded | MAU (2026) | Owner | Primary Format |
|---|---|---|---|---|---|
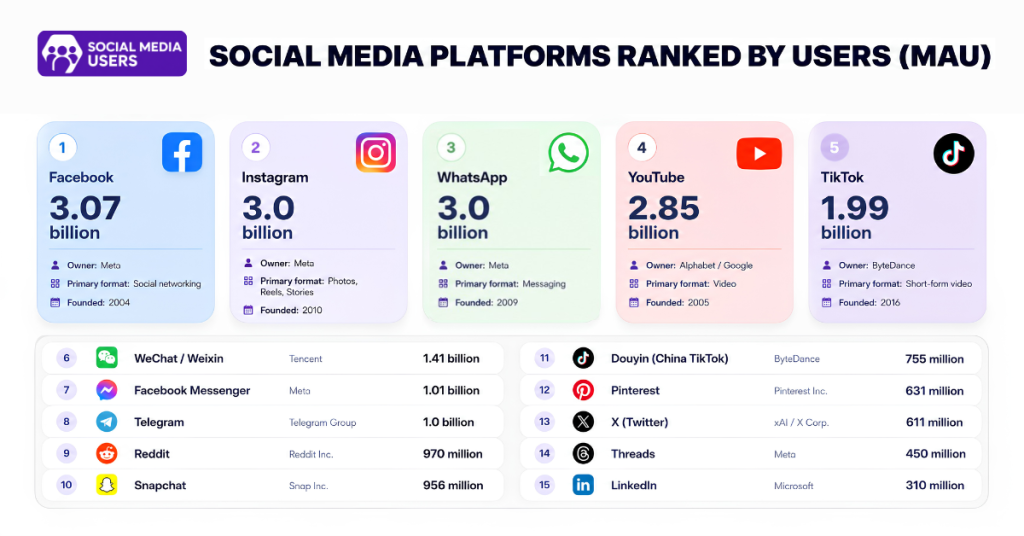
| 1 | 2004 | 3.07 billion | Meta | Social networking | |
| 2 | 2010 | 3.0 billion | Meta | Photos, Reels, Stories | |
| 3 | 2009 | 3.0 billion | Meta | Messaging | |
| 4 | YouTube | 2005 | 2.85 billion | Alphabet / Google | Video |
| 5 | TikTok | 2016 | 1.99 billion | ByteDance | Short-form video |
| 6 | WeChat / Weixin | 2011 | 1.41 billion | Tencent | Super app |
| 7 | Facebook Messenger | 2011 | 1.01 billion | Meta | Messaging |
| 8 | Telegram | 2013 | 1.0 billion | Telegram Group | Messaging |
| 9 | 2005 | 970 million | Reddit Inc. | Forums, communities | |
| 10 | Snapchat | 2011 | 956 million | Snap Inc. | Stories, AR |
| 11 | Douyin (China TikTok) | 2016 | 755 million | ByteDance | Short-form video |
| 12 | X (Twitter) | 2006 | 611 million | xAI / X Corp. | Microblogging |
| 13 | 2010 | 631 million | Pinterest Inc. | Visual discovery | |
| 14 | Threads | 2023 | 450 million | Meta | Text-based social |
| 15 | 2003 | 310 million | Microsoft | Professional networking |
Table Sources: Meta Q1 2026 Earnings, Alphabet Q1 2026, Snap Q1 2026, Pinterest Q1 2026, Reddit Q1 2026, DataReportal April 2026, Statista April 2026.
Time Spent per Platform (Daily Average)
| Platform | Avg. Daily Time | Primary Age Group |
|---|---|---|
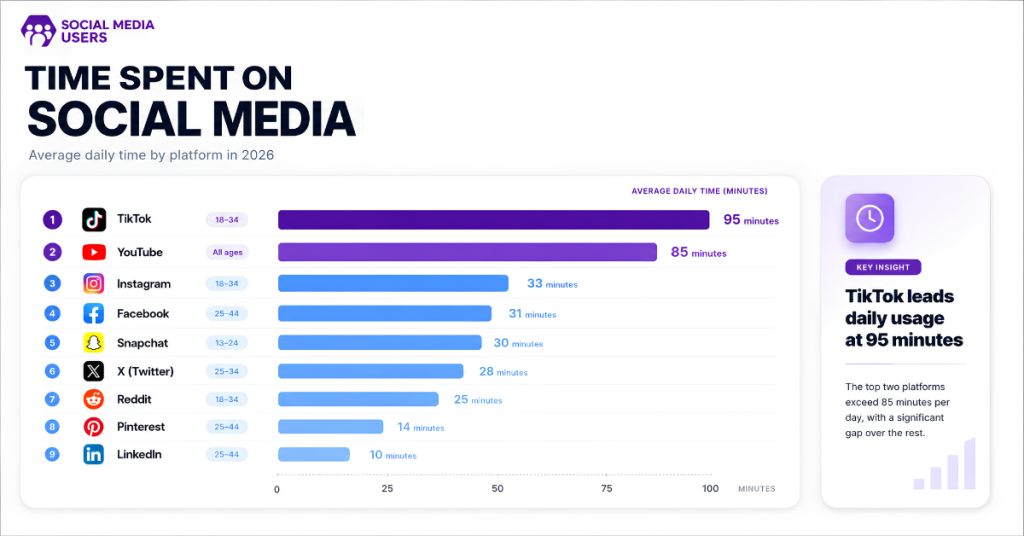
| TikTok | 95 minutes | 18-34 |
| YouTube | 85 minutes | All ages |
| 33 minutes | 18-34 | |
| 31 minutes | 25-44 | |
| X (Twitter) | 28 minutes | 25-34 |
| Snapchat | 30 minutes | 13-24 |
| 10 minutes | 25-44 | |
| 25 minutes | 18-34 | |
| 14 minutes | 25-44 |
Table Source: DataReportal, GWI Consumer Survey Q1 2026, Sprout Social. Time ranges reflect different measurement methodologies.
Social Media Users by Country
China and India dominate by absolute numbers, but the growth story is elsewhere. India is adding users faster than any other country in absolute volume and is projected to overtake China by 2029.
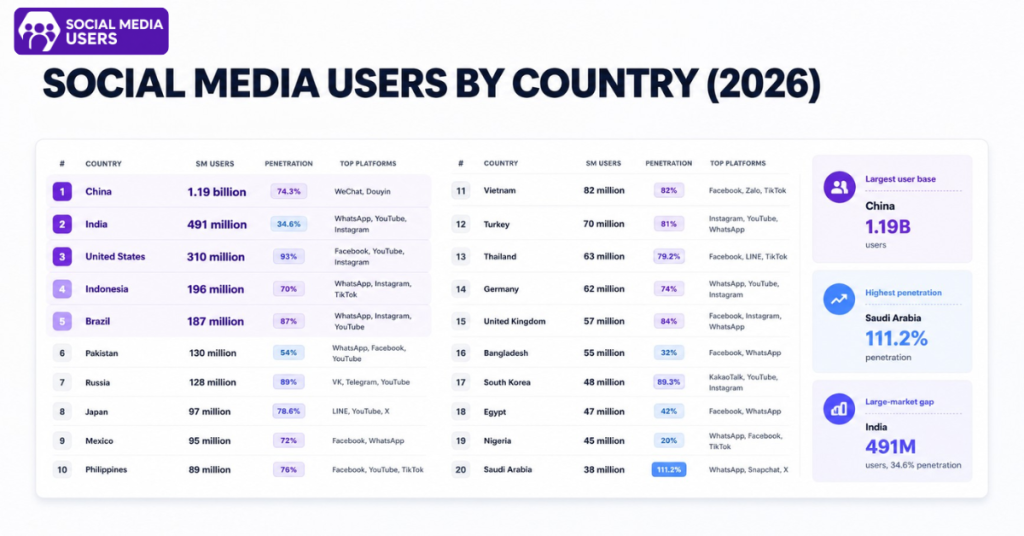
Pakistan’s social media user base is projected to double from 130 million in 2025 to 263 million by 2030. The six largest unconnected markets (India, Nigeria, Bangladesh, Pakistan, Ethiopia, Egypt) collectively hold 3.1 billion people but only 500 million social media users, representing the last major wave of global adoption.
| Rank | Country | SM Users (2026) | Penetration Rate | Dominant Platform |
|---|---|---|---|---|
| 1 | China | 1.19 billion | 74.3% | WeChat, Douyin |
| 2 | India | 491 million | 34.6% | WhatsApp, YouTube, Instagram |
| 3 | United States | 310 million | 93% | Facebook, YouTube, Instagram |
| 4 | Indonesia | 196 million | 70% | WhatsApp, Instagram, TikTok |
| 5 | Brazil | 187 million | 87% | WhatsApp, Instagram, YouTube |
| 6 | Russia | 128 million | 89% | VK, Telegram, YouTube |
| 7 | Japan | 97 million | 78.6% | LINE, YouTube, X |
| 8 | Mexico | 95 million | 72% | Facebook, WhatsApp |
| 9 | Philippines | 89 million | 76% | Facebook, YouTube, TikTok |
| 10 | Vietnam | 82 million | 82% | Facebook, Zalo, TikTok |
| 11 | Turkey | 70 million | 81% | Instagram, YouTube, WhatsApp |
| 12 | Thailand | 63 million | 79.2% | Facebook, LINE, TikTok |
| 13 | Germany | 62 million | 74% | WhatsApp, YouTube, Instagram |
| 14 | United Kingdom | 57 million | 84% | Facebook, Instagram, WhatsApp |
| 15 | South Korea | 48 million | 89.3% | KakaoTalk, YouTube, Instagram |
| 16 | Nigeria | 45 million | 20% | WhatsApp, Facebook, TikTok |
| 17 | Pakistan | 130 million | 54% | WhatsApp, Facebook, YouTube |
| 18 | Bangladesh | 55 million | 32% | Facebook, WhatsApp |
| 19 | Egypt | 47 million | 42% | Facebook, WhatsApp |
| 20 | Saudi Arabia* | 38 million | 111.2% | WhatsApp, Snapchat, X |
*Penetration rates above 100% (Saudi Arabia) indicate multiple accounts per person. User estimates vary across sources due to different methodologies.
Sources: DataReportal, Statista, Axis Intelligence, DemandSage
Social Media Penetration Rates
Social media penetration, the percentage of a country’s total population that uses social media, reveals the structural digital divide more clearly than raw user counts. The UAE leads at 99%, while Ethiopia sits at 11.8%, an 87-point gap. The global average stands at 63.8%. Countries above 80% are considered near-saturation markets where growth comes from deeper engagement, not new users.
Highest Penetration Countries
| Country | Penetration Rate | Tier |
|---|---|---|
| Saudi Arabia | 111.2% | Hyper-saturated |
| UAE | 99% | Hyper-saturated |
| South Korea | 89.3% | Near-saturation |
| United States | 93% | Near-saturation |
| Russia | 89% | Near-saturation |
| Brazil | 87% | Near-saturation |
| United Kingdom | 84% | Near-saturation |
| Vietnam | 82% | Near-saturation |
| Thailand | 79.2% | High |
| Japan | 78.6% | High |
| China | 74.3% | High |
| Mexico | 72% | High |
| Indonesia | 70% | High |
Sources: DataReportal, Statista
Penetration by Region
| Region | Penetration Rate (2025) | User Growth YoY |
|---|---|---|
| Eastern Asia | 80% | +3.5% |
| Northern Europe | 83.6% | +1.5% |
| Western Europe | 83.3% | +1.4% |
| North America | 81% | +1.3% |
| Southern Europe | 76.7% | +2.5% |
| Southeast Asia | 72% | +6% |
| Latin America | 70% | +5% |
| Middle East / North Africa | 60% | +7% |
| South Asia | 40% | +10% |
| Sub-Saharan Africa | 18% | +12% |
| Global Average | 63.8% | +5.4% |
Sources: DataReportal, Statista
Social Media Demographics
Social media demographics in 2026 reveal a market that is younger, increasingly balanced by gender, and stratified sharply by platform. Users aged 18 to 34 make up roughly 63% of the global social media audience, with the 25-to-34 bracket alone accounting for 33.3%.
But the fastest-growing segments are on the edges: TikTok’s 35+ audience is growing 3x faster than Instagram’s in the same age group, while Facebook and YouTube maintain the broadest cross-generational appeal.
Age Distribution
| Age Group | Share of Global SM Users | Most Popular Platform |
|---|---|---|
| 13-17 | ~8% | TikTok, Snapchat |
| 18-24 | 29.7% | TikTok, Instagram, Snapchat |
| 25-34 | 33.3% | Instagram, Facebook, LinkedIn |
| 35-44 | 16.0% | Facebook, YouTube, WhatsApp |
| 45-54 | 7.5% | Facebook, YouTube |
| 55-64 | 3.8% | Facebook, YouTube |
| 65+ | ~2% | Facebook, YouTube |
Sources: DataReportal, Vista Social, Sprout Social
Gender Distribution
- Global social media users: 54.6% male, 45.4% female. (DataReportal 2026)
- In the United States, usage is nearly even: approximately 50-50 male-female split. (Pew Research)
- Pinterest: 70% female users. (Pinterest Q1 2026)
- LinkedIn: 56.4% male, 43.6% female globally. (LinkedIn)
- X (Twitter): 60.9% male, 39.1% female, one of the widest gender gaps. (Post Everywhere 2026)
- Instagram: 52.7% male, 47.3% female globally; 55.4% female in the US. (Piktochart, Sprout Social)
Generational Usage Patterns
- Gen Z (born 1997-2012): Spends approximately 3.5 hours daily on social media. Uses social media as a replacement for search engines and shopping. Most active on TikTok, Instagram, and Snapchat. (AutoFaceless 2026, Creative Noggin)
- Millennials (born 1981-1996): Active across multiple platforms with strong YouTube, Facebook, and Instagram engagement. Short-form video and lifestyle content perform well. (Creative Noggin)
- Gen X (born 1965-1980): Gravitates toward Facebook and YouTube. Moderate Instagram usage relative to younger groups. (Creative Noggin)
- Baby Boomers (born 1946-1964): Average 1.5 hours daily. Primarily Facebook and YouTube. Instagram and TikTok usage remains significantly lower. (AutoFaceless 2026)
Time Spent on Social Media
The global average daily time spent on social media is 2 hours and 21 minutes per user (DataReportal / GWI 2026). This figure has been gradually declining from a peak of approximately 2 hours 31 minutes during the COVID-19 pandemic years (2020-2021), reflecting both platform fatigue and a shift toward shorter, more intentional sessions. However, total time on social media continues to grow in absolute terms because the user base keeps expanding.
Daily Time Spent by Country
| Country | Daily Time on Social Media |
|---|---|
| Kenya | 3 hours 43 minutes |
| Nigeria | 3 hours 38 minutes |
| South Africa | 3 hours 36 minutes |
| Brazil | 3 hours 31 minutes |
| Philippines | 3 hours 28 minutes |
| Colombia | 3 hours 25 minutes |
| Argentina | 3 hours 14 minutes |
| Indonesia | 3 hours 11 minutes |
| Mexico | 3 hours 07 minutes |
| United States | 2 hours 19 minutes |
| United Kingdom | 1 hour 48 minutes |
| Germany | 1 hour 33 minutes |
| South Korea | 1 hour 27 minutes |
| Japan | 53 minutes |
| Global Average | 2 hours 21 minutes |
Source: DataReportal / GWI Q1 2026. Japan consistently records the lowest daily social media time among major economies.
Weekly Time Spent
- Global average weekly time on social media: 7 hours 5 minutes for users aged 16+. (GWI Q4 2024)
- US average weekly time: 8 hours 50 minutes, above the global average. (Backlinko)
- Gen Z averages 28 hours per week across all social platforms. (GWI 2026)
United States Social Media Data
The United States remains the third-largest social media market by total users (behind China and India) and the most commercially valuable market by advertising revenue per user. 310 million Americans use social media in 2026, representing approximately 93% of the total population. Growth has plateaued, with Statista projecting 330 million users by 2029.
US Platform Usage (Adults)
| Platform | US Users (2026) | % of US Adults |
|---|---|---|
| YouTube | 238 million | 83% |
| 177.5 million | 68% | |
| 143.3 million | 47% | |
| TikTok | 136 million | 33% |
| Snapchat | 108 million | 27% |
| 78 million | 30% | |
| 76 million | 32% | |
| X (Twitter) | 66 million | 22% |
| 56 million | 22% | |
| Threads | 32 million | — |
Table Sources: Pew Research 2025-2026, eMarketer, Backlinko, DemandSage. US adult percentages from Pew Research.
US Social Media by Generation
- Gen Z (18-26): 95%+ use social media. Most active on TikTok, Instagram, Snapchat, and YouTube. In the US, TikTok has surpassed Facebook among users under 30. (Pew Research, Creative Noggin)
- Millennials (27-42): 90%+ adoption. Strongest on YouTube, Facebook, and Instagram. 69.2% of 25-to-34 year-olds actively use social media. (Backlinko)
- Gen X (43-58): 77% adoption. Facebook and YouTube dominate. (Pew Research)
- Baby Boomers (59-77): 58% adoption. Facebook is the primary platform, followed by YouTube. (Pew Research)
US Social Commerce
- US social commerce revenue is projected to exceed $122.7 billion in 2026. (DataRefs, eMarketer)
- 34% of US consumer purchases now begin on a social platform. (Statista)
- Instagram and TikTok lead for product discovery among users under 35. (eMarketer)
Why People Use Social Media
Understanding why people use social media is as important as knowing how many use it. The motivations have shifted over the years, with entertainment and content consumption now rivalling the original purpose of staying connected with friends and family. Younger users increasingly treat social platforms as search engines, shopping tools, and news sources.
Top Reasons for Social Media Use (Global)
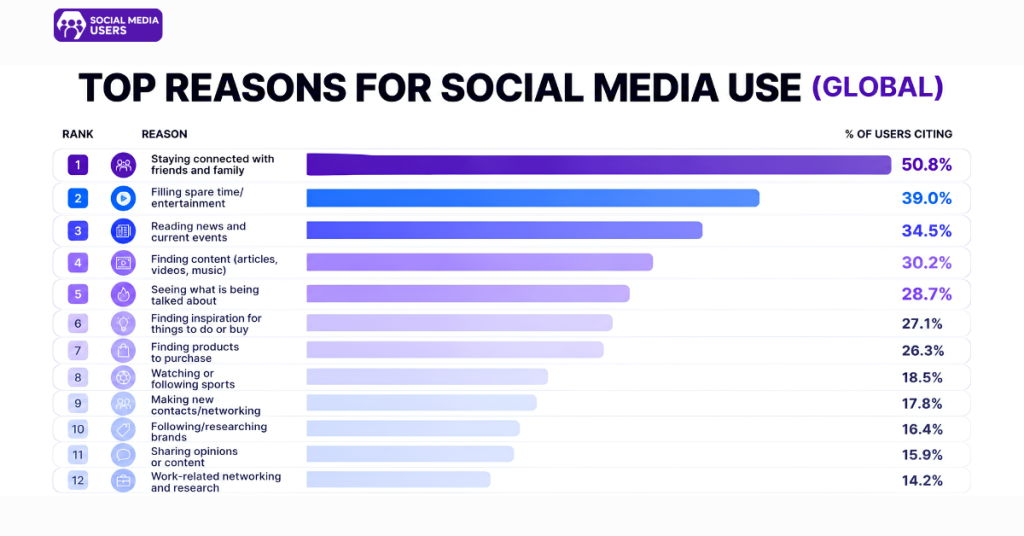
| Rank | Reason | % of Users Citing |
|---|---|---|
| 1 | Staying connected with friends and family | 50.8% |
| 2 | Filling spare time/entertainment | 39.0% |
| 3 | Reading news and current events | 34.5% |
| 4 | Finding content (articles, videos, music) | 30.2% |
| 5 | Seeing what is being talked about | 28.7% |
| 6 | Finding inspiration for things to do or buy | 27.1% |
| 7 | Finding products to purchase | 26.3% |
| 8 | Watching or following sports | 18.5% |
| 9 | Making new contacts/networking | 17.8% |
| 10 | Following/researching brands | 16.4% |
| 11 | Sharing opinions or content | 15.9% |
| 12 | Work-related networking and research | 14.2% |
Source: GWI (Global Web Index) Q4 2025 via DataReportal, DemandSage.
Generational Differences in Motivation
- Gen Z: 54% use social media to discover new products. 40% use TikTok or Instagram as a search engine instead of Google. Social media serves as both entertainment and commerce. (GWI, Pew Research)
- Millennials: Identity formation and community building rank high. Curating a social media presence to shape how they are perceived is a key driver. (GWI)
- Gen X and Boomers: Staying connected with family and reading news are the dominant motivations. Product discovery through social media is significantly lower than younger cohorts. (GWI, Pew Research)
Where Social Media Is Growing
The next billion social media users will come predominantly from South Asia and Sub-Saharan Africa. These regions combine large, young populations with rapidly expanding mobile internet access. India alone is projected to overtake China as the world’s largest social media market by 2029. Pakistan’s user base is expected to double by 2030.
Fastest-growing Markets
| Country / Region | Current Users | Projected Growth by 2030 |
|---|---|---|
| India | 491 million | Projected to overtake China by 2029 |
| Pakistan | 130 million | 262 million by 2030 |
| Bangladesh | 55 million | 116 million by 2030 |
| Nigeria | 45 million | 80 million by 2030 |
| Ethiopia | 14 million | Rapid mobile internet expansion |
| Sub-Saharan Africa (region) | 200 million | 12% annual growth |
| Southeast Asia (region) | 450 million | 6% annual growth |
“Getting online now almost universally means getting on social media. The gap between internet user and social media user has closed to just 5.3 percentage points.” — DataReportal / Axis Intelligence, 2026
Sources: DataReportal, Statista, Axis Intelligence, World Bank
Social Media Engagement and Behaviour
Content Format Preferences
- Short-form video is the dominant content type across all platforms. TikTok leads engagement with rates up to 5%. (DataRefs 2026)
- YouTube Shorts surpassed 200 billion daily views. (YouTube Q1 2026)
- Instagram Reels account for 50% of time spent on Instagram. (Meta Q1 2026)
- 37% of X (Twitter) users now engage most with short-form video, compared to 36% with text. (Sprout Social 2026)
- 70% of Pinterest users are women. 93% of pins are made by women. (Pinterest Q1 2026)
Multi-platform Behaviour
- The average user is active on 6.75 platforms per month in 2026, down slightly from a high of 6.86 in Q4 2024. (GWI Q2 2025 via DataReportal)
- In the US, average user engages with 6.5% of all social platforms available, suggesting attention is dispersing across apps rather than deepening on any single one. (DemandSage 2026)
- Meta’s Family of Apps (Facebook, Instagram, WhatsApp, Messenger, Threads) reached 3.56 billion daily active people in March 2026. (Meta Q1 2026)
Social Media and Mental Health
- 41% of Americans say they are actively reducing their screen time. (Piktochart 2026)
- Gen Z are both the heaviest social media users and the most likely to consider quitting. (GWI, DataReportal)
- Screen time reduction does not mean abandoning platforms; it means shorter, more intentional sessions. (GWI 2026)
How We Research Social Media Statistics
Our methodology combines source verification, editorial review and scheduled updates so every figure you cite reflects the current state of the industry.
| Element | Detail |
|---|---|
| Research period | 2024-2026 |
| Sources reviewed | 35+ |
| Update schedule | Monthly |
| Data standard | Original source verification, platform earnings cross-referencing |
| Coverage | Global, 190+ countries |
| Key data providers | DataReportal, Statista, GWI, Kepios, Pew Research, Platform IR disclosures |
| Methodology note | User identity counts (5.79B) overstate unique humans (est. 4.6B) due to multi-account behaviour |
Trusted Research Sources
Every statistic in this report can be traced to a primary research source. We rely on the following organisations for verified industry data.
[1] DataReportal – Global Social Media Users & Digital 2026 Overview
[2] DataReportal – Digital 2026: Global Overview Report
[3] Statista – Number of Internet and Social Media Users Worldwide 2026
[4] Statista – Social Media Penetration Rate by Region 2025
[5] Kepios – Social Media User Analysis April 2026
[6] GWI (Global Web Index) – Social Media Consumer Survey Q1 2026
[7] We Are Social – Digital 2026 Partnership Reports
[8] Meta Investor Relations – Q1 2026 Earnings (Facebook, Instagram, WhatsApp)
[9] Alphabet / Google – Q1 2026 Earnings (YouTube)
[10] Snap Inc. – Q1 2026 Earnings (Snapchat 956M MAU)
[11] Pinterest – Q1 2026 Earnings (631M MAU)
[12] Reddit – Q1 2026 Earnings (126.8M DAU, 970M MAU)
[13] Pew Research Center – Social Media Use in 2025-2026
[14] Sprout Social – Social Media Demographics 2026
[15] HubSpot – State of Marketing Report 2026
[16] Backlinko – Social Network Usage & Growth Statistics 2026
[17] DemandSage – How Many People Use Social Media 2026
[18] eMarketer – Social Media Topics & Forecasts
[19] Axis Intelligence – Social Media Users Worldwide: 5.79B in 2026
[20] DataRefs – Social Media Statistics 2026
[21] Vista Social – Complete Social Media Demographics Guide 2026
[22] Conbersa – Social Media Statistics Worldwide 2026
[23] AutoFaceless – Social Media Demographics Statistics 2026
[24] Post Everywhere – Social Media Demographics 2026
[25] Creative Noggin – 2026 Social Media Demographics
[26] Piktochart – How Many People Use Social Media in 2026
[27] BusinessTats – Most Used Social Networks 2026 by MAU
[28] Publora – Top 20 Social Media Platforms 2026
[29] Apaya – Social Media Marketing Statistics 2026
[30] Similarweb – App Intelligence & Social Media Benchmarks
[31] data.ai (Apptopia) – Mobile App Analytics
[32] LinkedIn – Official Newsroom & Member Data
[33] Telegram – Official Blog (1B MAU Milestone)
[34] TikTok / ByteDance – Transparency Reports